Keeping the Lights On
We take our responsibility of providing reliable power very seriously. Each year, about two-thirds of our capital and operating and maintenance budgets are devoted to reliability projects. In 2014 that included improvements to our Whitehorse spillway, a major upgrade to our Takhini substation north of Whitehorse, and overhauls to some of our hydro and back-up diesel generators.
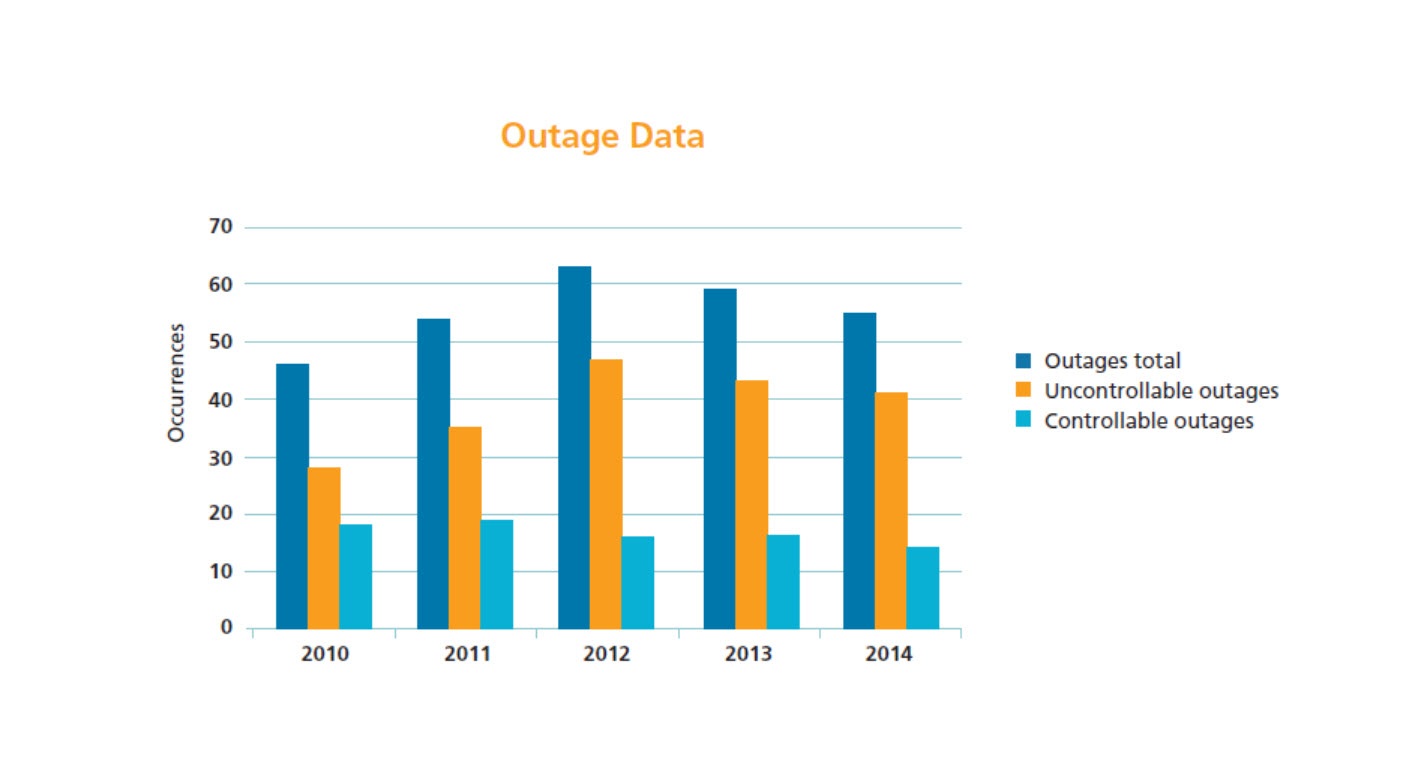
Our work is paying off, as you can see from the charts below. The first chart shows the total number of outages we have had over the past five years, which is the royal blue bar graph. We had 55 outages in 2014, compared to 59 in 2013, and 63 in 2012. This graph is broken down into uncontrollable outages (outages caused by high winds, snow or ice on the transmission lines, and trees or animals contacting the lines), and controllable outages (loss of supply, defective equipment or human error). In both cases, these numbers have dropped since 2013. Uncontrollables went from 43 to 41, and controllables from 16 to 14.
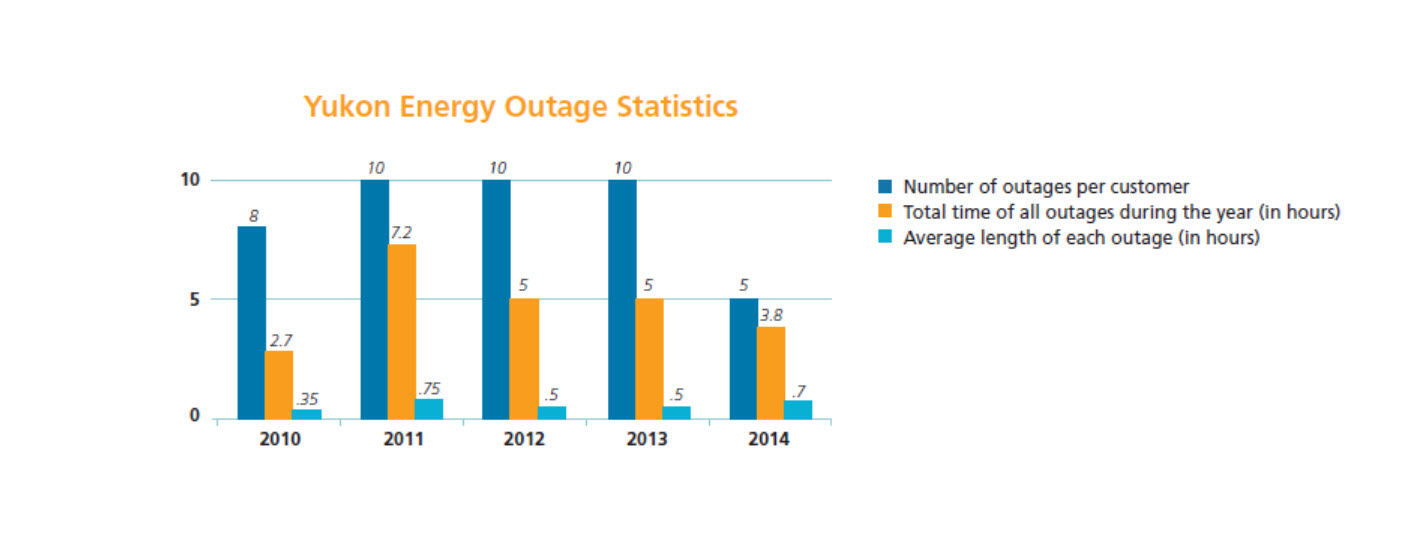
The other part of the story is told by the second graph, below. It shows that in 2014, the average number of outages experienced by our customers was 5, down from 10 the year before (see the royal blue bar). The total amount of time in the year that power was out for our customers was 3.8 hours, down from 5 hours in 2013 (yellow bar). The average length of each outage was up a bit in 2014 by less than 15 minutes (light blue bar).
We will continue working to improve these numbers, and commit to providing you with the most reliable service possible.
Comments
Be the first to comment